
Today it is Revenue Management Heaven.
We never had so much data to harness insights. At the same time it is a blessing and a curse. When looking at one data set everything is okay, when looking at two we can easily understand cause and effect. But when we look at 3 or more data sets more things start to get complicated. At this moment human biases kick in.
Unfortunately most outcomes are never the result of one action, they re not single-dimensional. If an individual hotel or hotel chain is successful it is often the result of a collection of actions, strategies and teams working on different objectives. At the same time when things go south it is also often a collection of wrong choices and different pain points deteriorating over time. Performance issues do not materialise overnight. It is often a long process with negative underlying trends building up. While tactically all might seem okay these underlying trends are slowly reinforcing each other until the business starts to be under pressure or not performing to its optimum.
Traditional but also “new wave” Revenue Management systems look only at the tactical part. What’s the demand out there, what business should I restrict or what price should I put out there next day, next week, next month, etc. And this might be per rate plan or channel. Again this is only the tip of the iceberg.
So we need to rethink how these systems are and behave. First of all they need to connect to multiple data sources and be more strategic. You want to monitor a few categories of data points.
Some examples of which these might be:
- Market Demand Trends. In this category you will monitor anything that has to do with external Trends that will help you establish the evolution of demand for the market and your property. That might be Competitive Data such as Demand360, OTA’s Demand, forward looking Market Share, Airline arrivals, GDS on the books for Hotel and Compset. Again, here you want to look at the data strategically and not only tactically.
- Hotel Internal Trends. These would be the more traditional ones. However what you want to start doing is combining internal data points with external. You don’t want to gather the data in one place and then have a siloed approach within your application. Say for example your direct booking channel is pacing down for a particular period vs last year, then you want the system to deliver you in one place search and conversion data from Google Analytics. If your OTA business is down then it should deliver you Search trends for your hotel but also for your competition. And while this might be in a fixed dashboard today, tomorrow it will be auto-compiled based on what the system has found in the data. This is just one example but you can connect the dots elsewhere.
- Customer Trends. Digitalisation starts with putting the customer in the centre. That is from a service delivery perspective but also from an analytics perspective. A good CRM will give you all the relevant KPI’s. Combining data such as frequency or Loyalty with Production patterns in your PMS (for Displaced business for example) will add an extra dimension in your Analysis. Also acquisition costs can be mapped down to the customer level. Combined with frequency will give you a good idea of Acquisition vs lifetime value. you might want to spend more in acquisition when your frequency and extra spend is high and the business lands on the right dates.
- Market Share Trends. This one could be a whole post by itself. Let’s stick to two ways. Daily you can look at it vs your segment performance or vs Demand 360 to identify where things went well or where things went wrong. Or you can also look at rolling X months performance that will give you more perspective. You could calibrate further your market share by looking at reviews.
- Acquisition Cost Trends. This is a big one and we have covered it enough in other articles. Key is 1) to get as granular possible, 2) Be forward looking 3) Include all acquisition costs. All of this you will combine and look at by segment and channel. For example, a drop in booking pace might be the result of different causes:
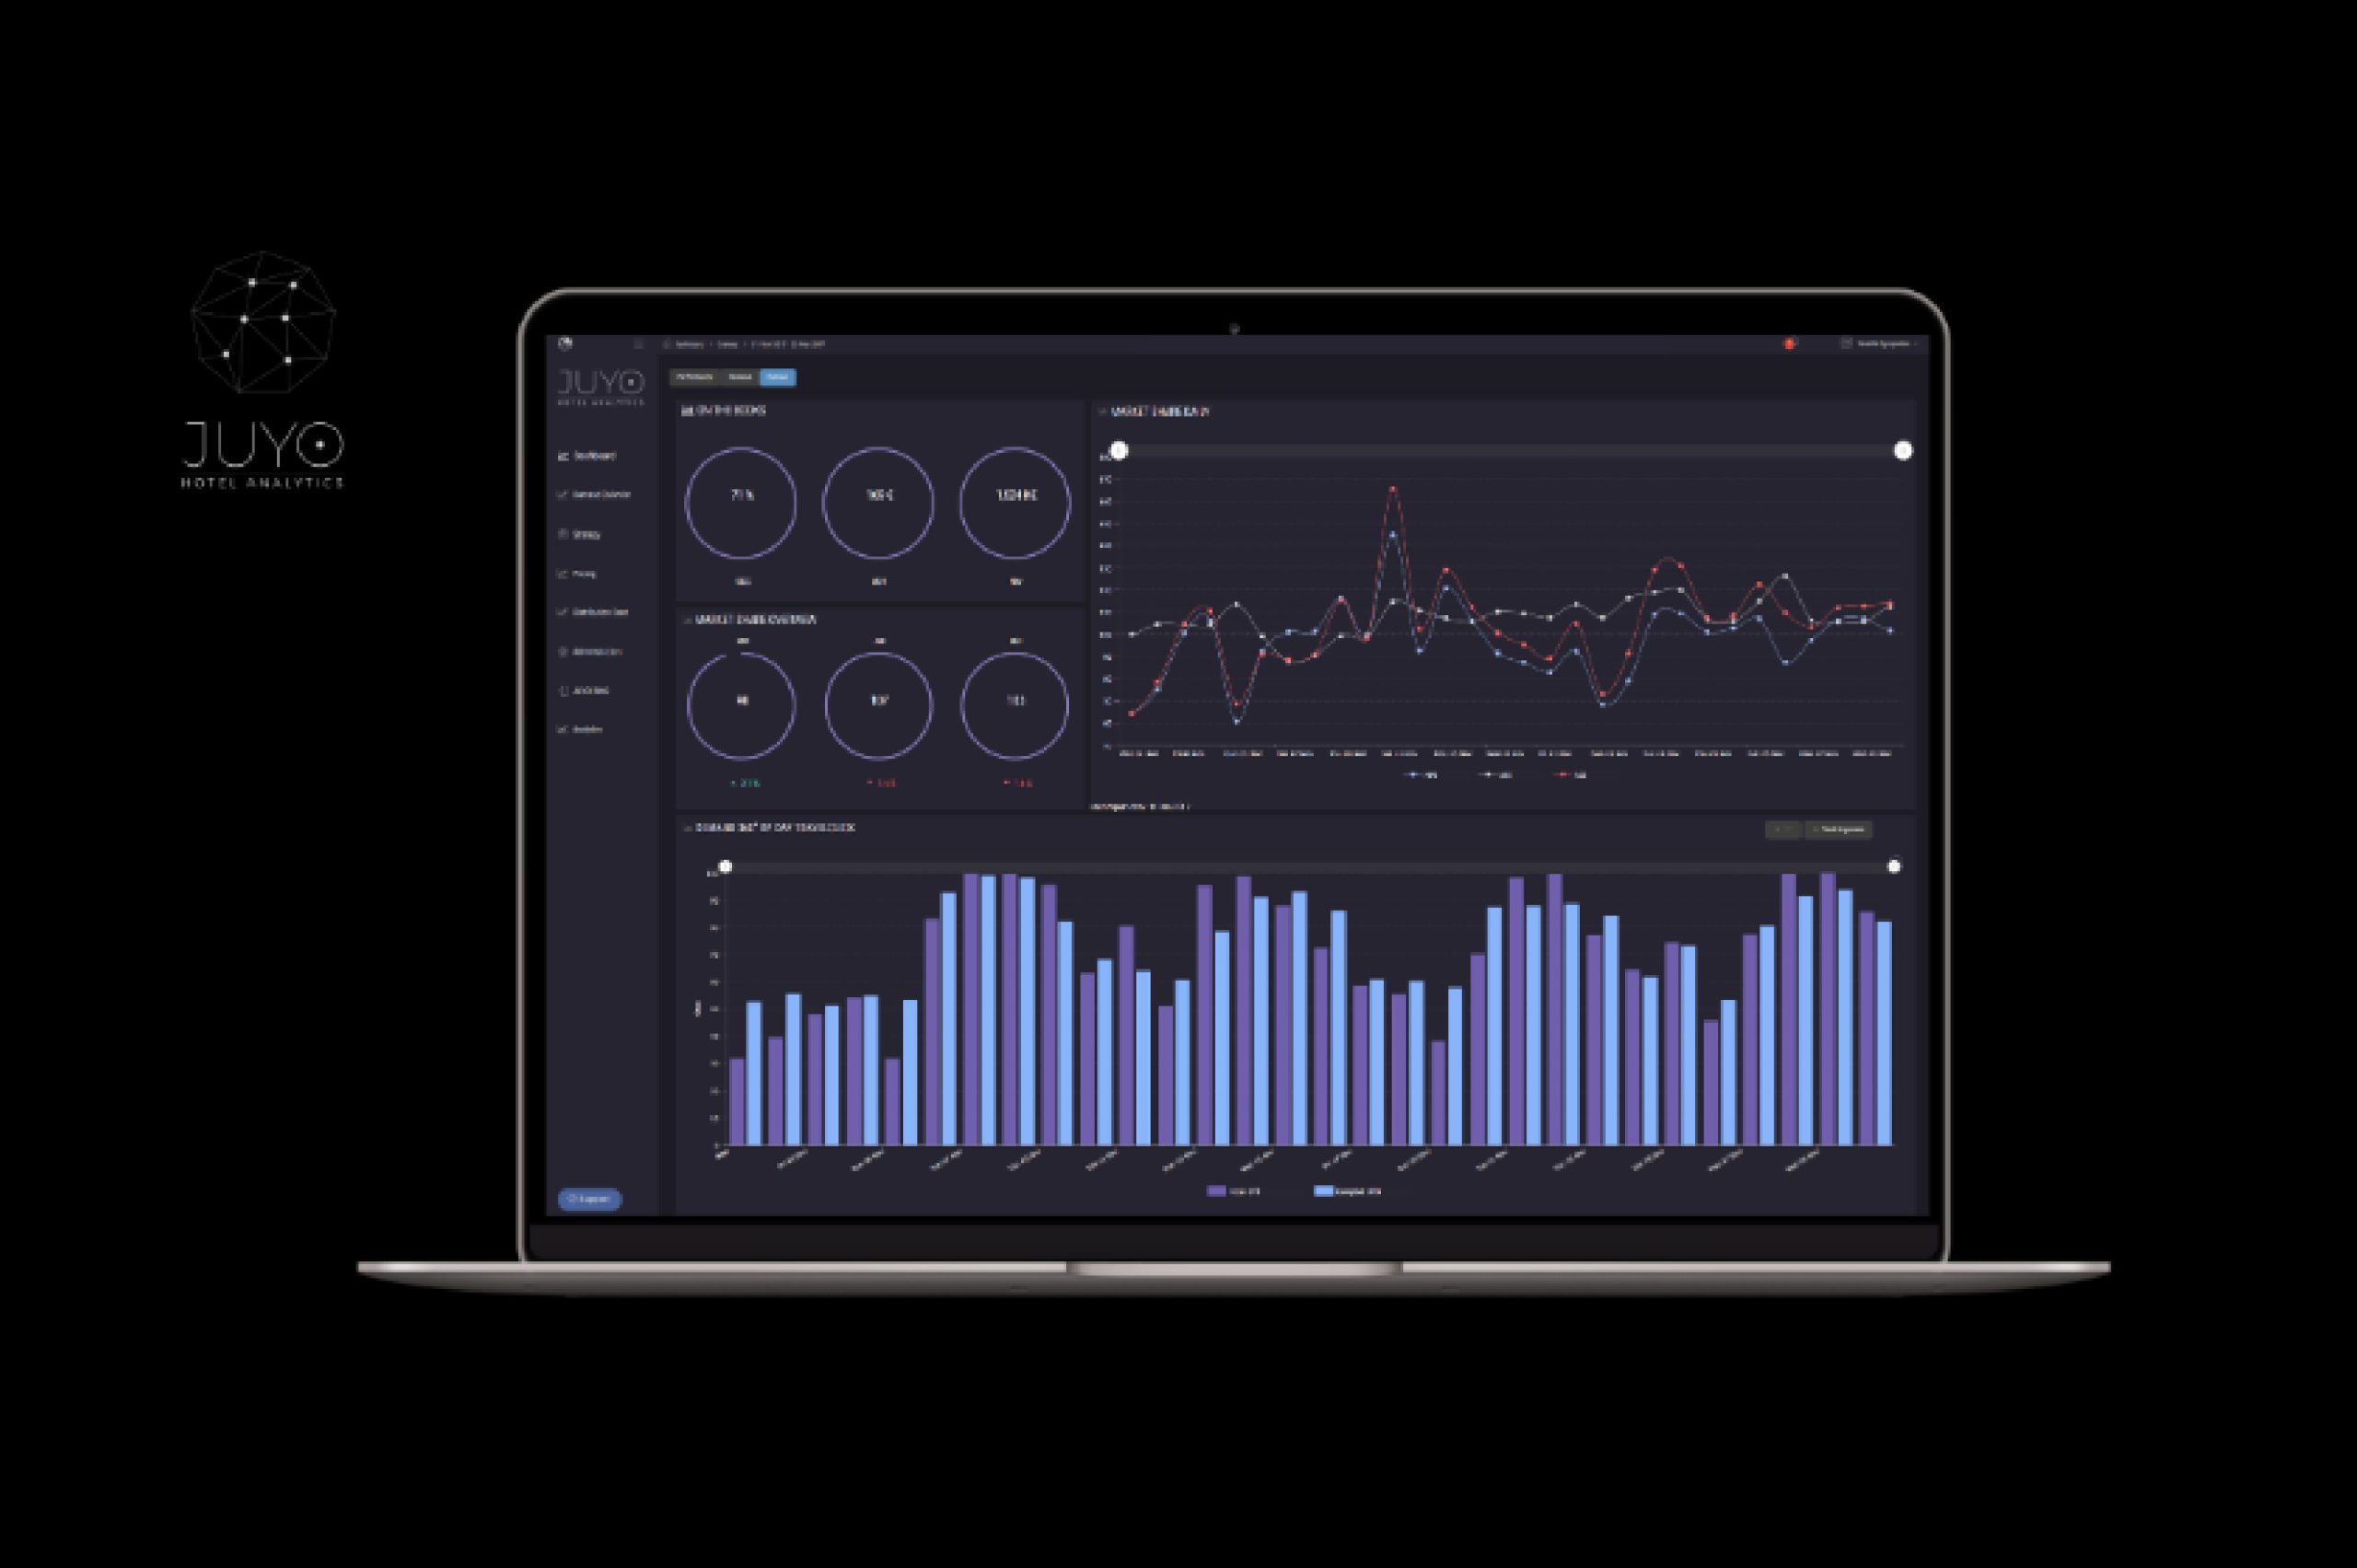
Article written by Vassilis Syropoulos, Founder and CEO of JUYO Analytics.
HSDS has built Cloud Platforms for „Analytics & Revenue Management”, and „Central Reservation & Distribution Platforms” for their clients, which are revolutionary and setting new Industry standards. Contact us today and find out more!